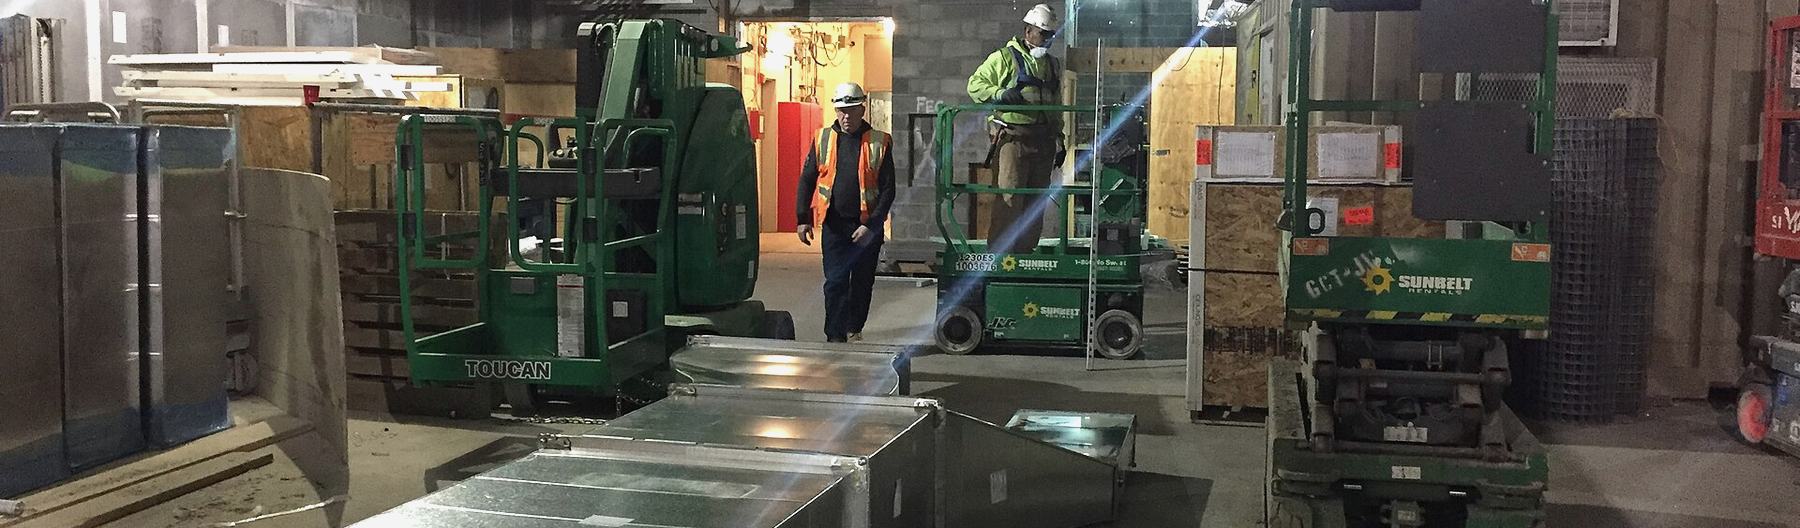
Where the data comes fromEntered by officials in the field, on the phone already in their pocket.
The platform
Officials enter from any device. Leadership sees the jurisdiction. Everything on this page is the running product — recorded and captured from the live platform, not drawn for a website.
projects tracked in the demo tenant
modules — dashboard to official scorecard
signatory contractors in the directory
new hardware, IT projects, or spreadsheets
Total projects, bid win rate, hours lost to non-union, waiver-gap exposure, and the subs winning your work — on one screen, the moment you log in. No hunting through spreadsheets or industry reports.
Every project in the jurisdiction plotted and colour-coded by status. Filter to pipeline, active, partial data or complete and the map answers immediately — this recording is the filter being used, not a slideshow.
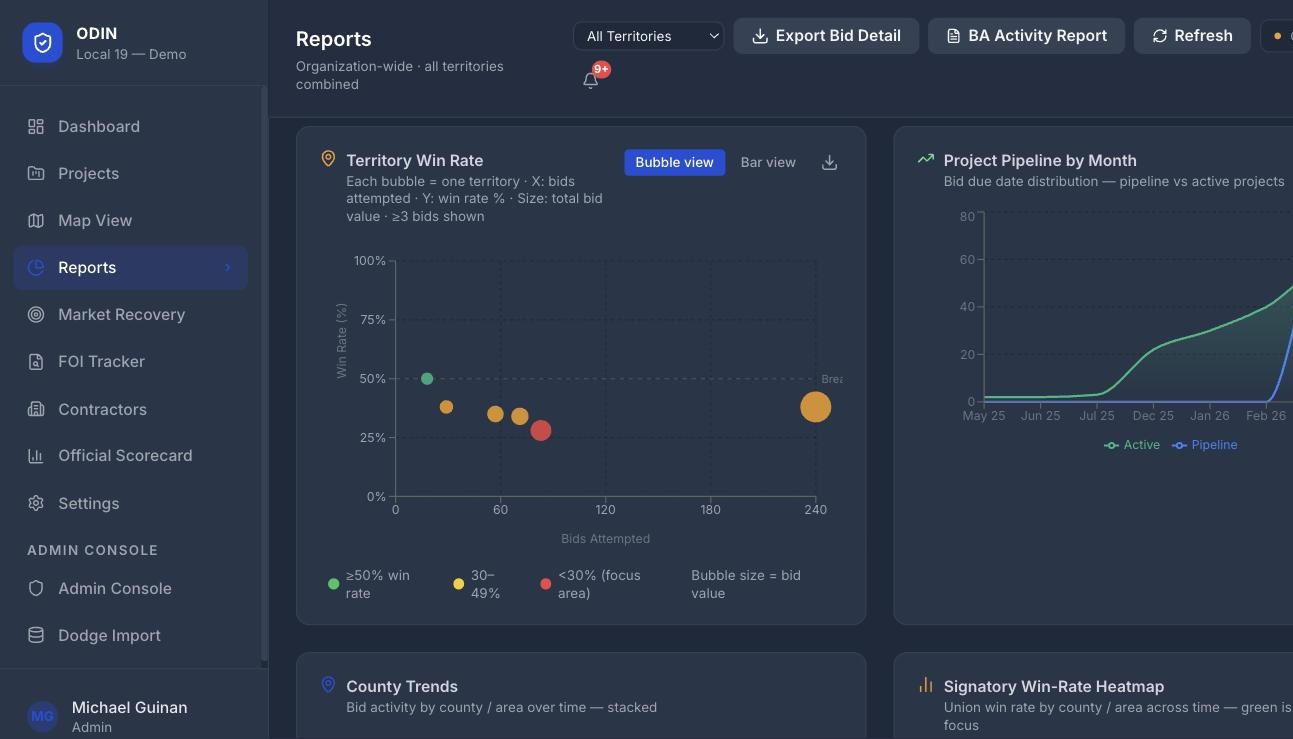
Territory win rate plotted against bids attempted, pipeline by month, county trends, and a signatory win-rate heatmap. Where you are strong, and where you are not.
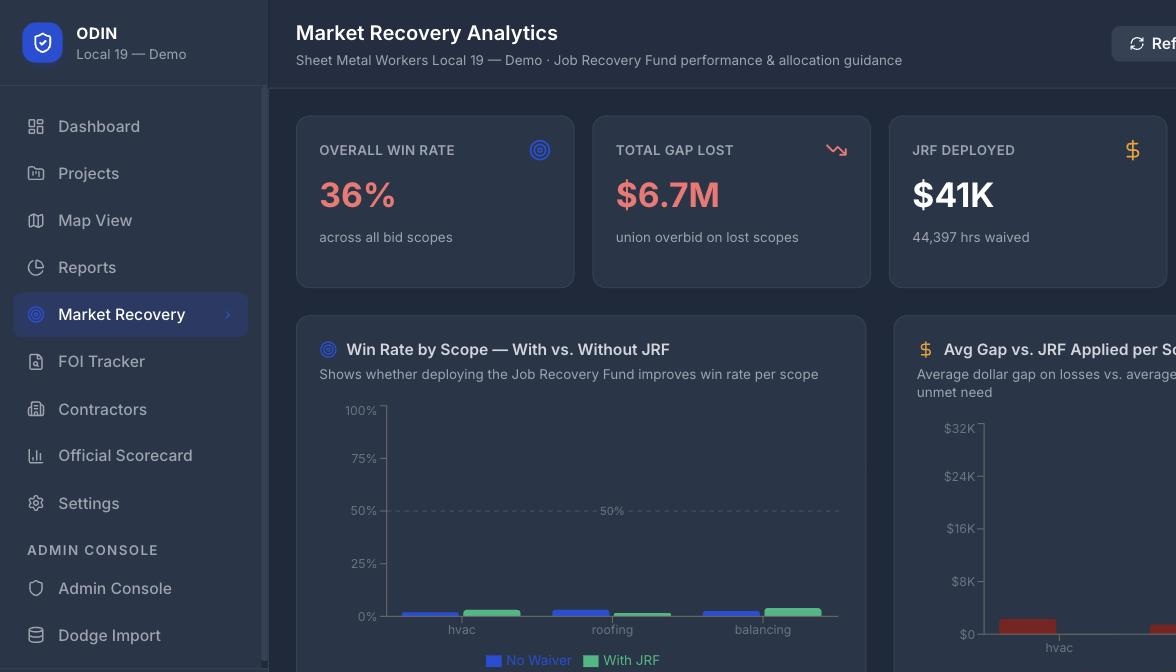
The one that changes the conversation. The total dollar gap on lost bids, the Job Recovery Fund deployed against it, and the closeable tail — the losses that were within reach.
Under the hood
Each local's data is isolated at the database level. Nothing is pooled, sold, or shown to another local.
A phone at 6 a.m. on the job site or a desktop in the hall. Same platform, same record.
Industry project data imports in bulk alongside official field entry, instead of being read line by line.
Project status derives from the bid data itself — pipeline, active, partial, complete — so the board is never out of date.
Territory coverage by official, so leadership can see effort and gaps without guessing or asking.
Right-to-know requests logged and followed inside the same system as the bids they support.
Bid scopes, rates, officials and territories are set up per local. Nothing in the platform is hard-wired to one craft — the demo tenant simply had to be some trade.
Let's calculate them together — from your own collective bargaining agreement, on a thirty-minute screen share. No cost, no obligation, and nothing to install first.
Michael Guinan, Founder & CEO — mguinan@odin-union.com